


This year, Emerging Markets (EM) are in the spotlight. Starting with the Russia-Ukraine conflict, followed by the imposition of large lockdowns in China in April, which disrupted global supply chains, EM have been on investors’ minds all year long. We believe that going forward, numerous emerging economies will benefit more from the macroeconomic situation and the commodity markets dynamics than developed markets (DM). We favour Latin America and several commodity exporters in the Middle East and Africa. In our opinion, commodity-exposed companies in these parts of the world can provide a natural hedge for investors in the current environment thanks to their improved cash flow generation.
Despite multiple uncertainties, EM are stronger today than during the taper tantrum in 2013
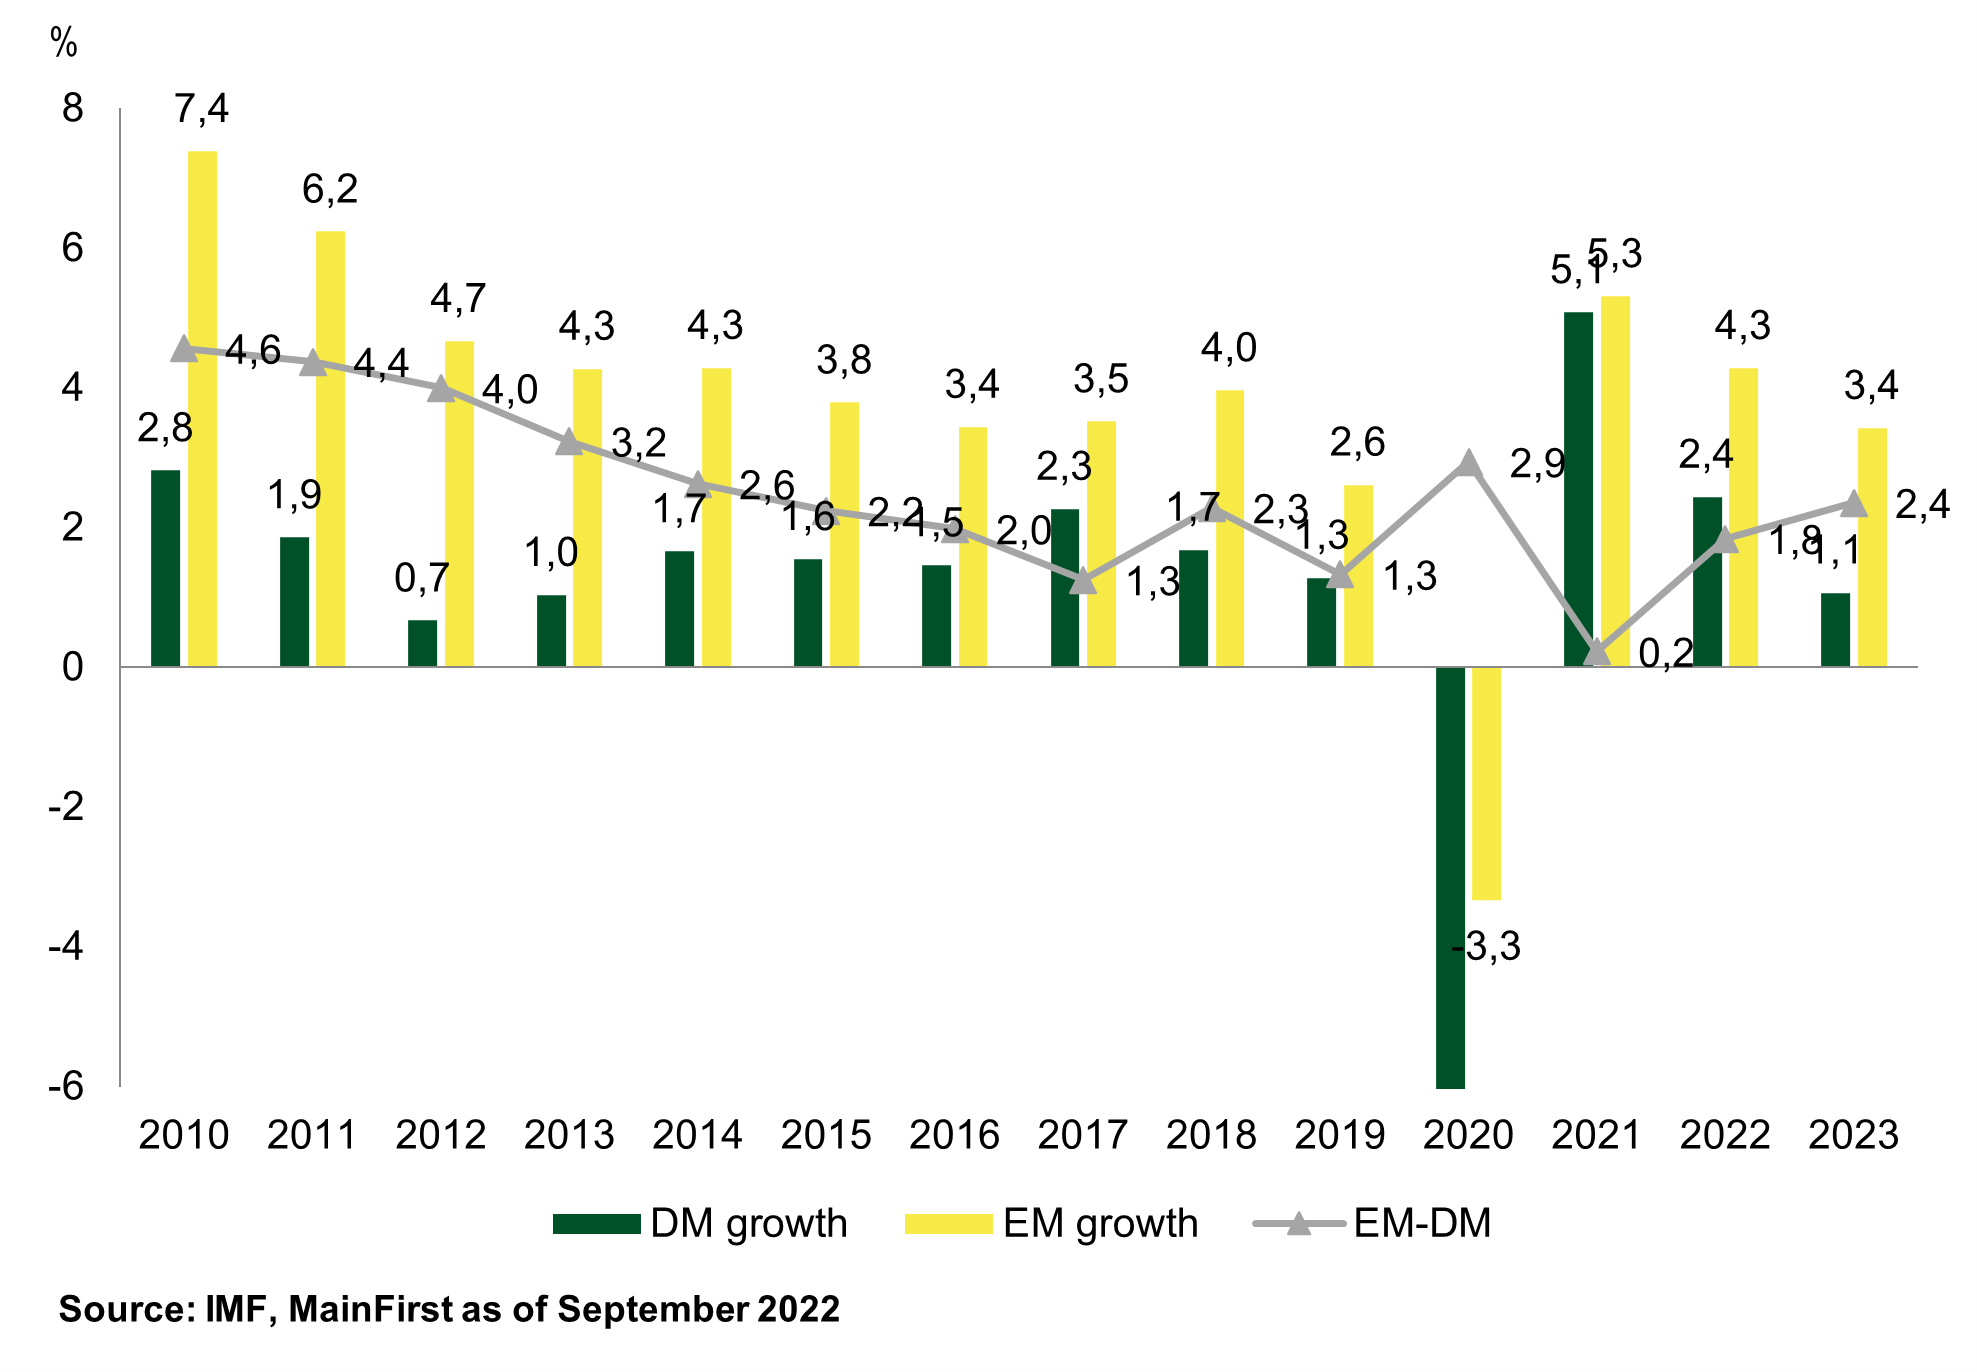
While Europe is struggling with an energy crisis and rising inflation, and the US will inevitably slow down in the face of aggressive monetary tightening by the Fed, Emerging Markets will be the main beneficiaries of rising commodity prices resulting from imbalanced commodity markets. During its last revision in July, the IMF has cut the 2023 growth estimation for the US and Germany by 1.3% and 1.9% respectively, to 1% for the US and 0.8% for Germany. While non-DM countries were not spared from growth cuts, the negative growth revision for EM was much lower than for DM. Fig 1 shows the growth differential between the main emerging and developed countries. After a long-term decline of the growth differential, the relative growth of EM countries is expected to pick up considerably and might get close to levels last seen in 2014.
Fig 1. Comparison of EM and DM growth rates. Growth rates are computed as the average growth rate of the seven largest emerging countries (exc. Russia) and the average growth rate of the seven largest developed countries. The differential is computed as the difference between these two averages.
The overall EM space is less vulnerable today than during the 2013 taper tantrum.
First, some countries improved their external positions. For instance, India has doubled its foreign exchange (FX) reserves since 2012. While its external debt also increased, it did so at a slower pace, improving the ratio of FX reserves over external debt and therefore improving the resilience of the country to external vulnerabilities. India, Mexico, China and South Korea all managed to decrease the weight of short-term debt over their external liabilities.
Secondly, central banks in Latin America were faster than the Federal Reserve in raising their policy rates to rein in inflation. Brazil, Mexico, Peru and Colombia started tightening their policy rates back in 2021. This prevented large capital outflows and increased the real interest rate differential with the US, sustaining the currencies of Brazil and Mexico in particular. Latin America was the only region in the EM space reporting positive portfolio flows for the first eight months of 2022 with USD 37bn (IIF data).
Thirdly, domestic bond markets are larger today than in 2013, this is due to providing additional refinancing options to EM countries, in particular in a situation of rising USD. As far as the USD is concerned, it is worth highlighting that the USD has risen sharply compared to G10 currencies but is more stable against EM currencies. BRL and MXN are both positive year-to-date. After the parabolic move up of the USD this year, we believe that this trend might soon start to reserve as investors reduce their bullish bets.
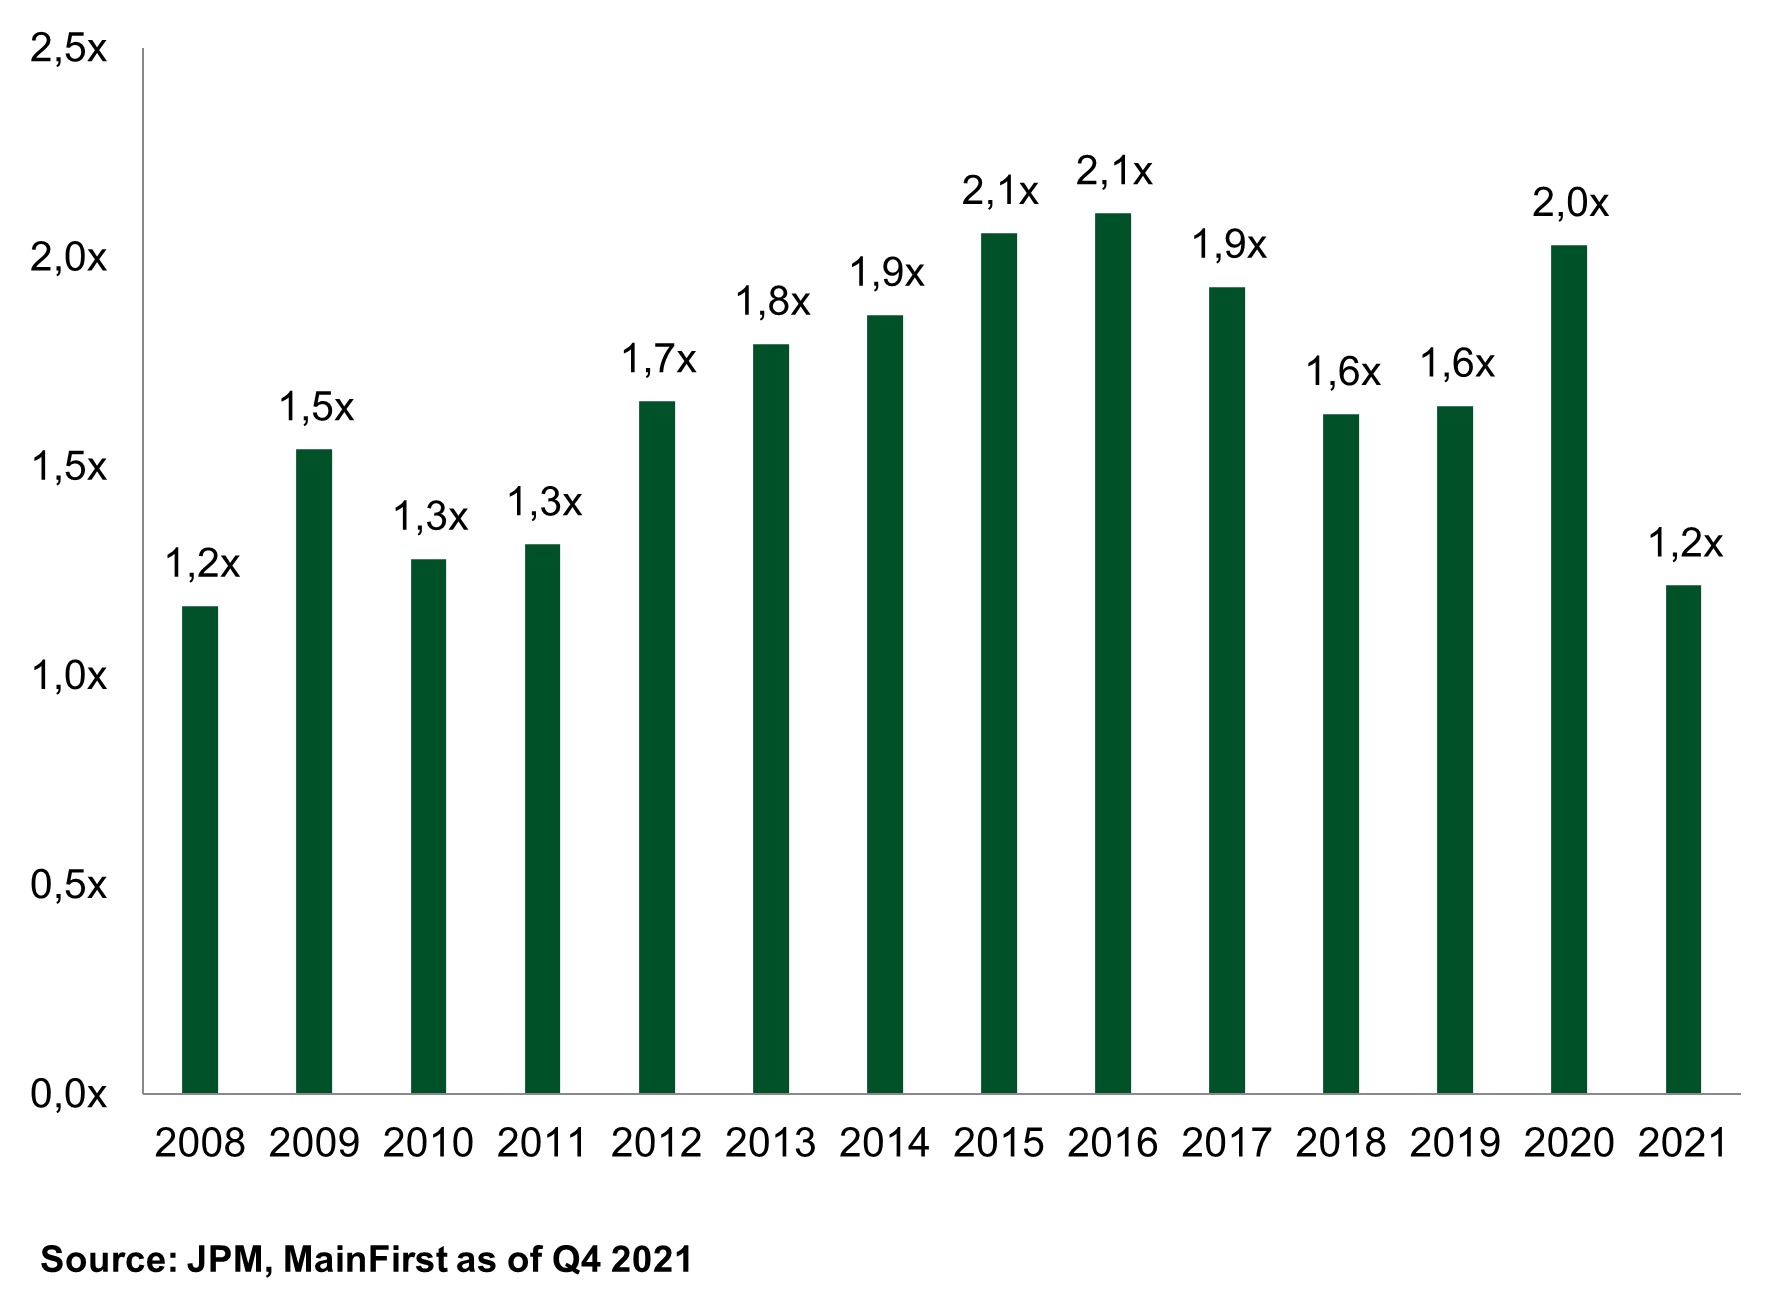
Lastly, and most importantly from a corporate stability perspective, EM companies entered this downturn with solid fundamentals. As shown by Fig 2, the net leverage at the beginning of this year was at historically low levels. When comparing to the rest of the world, EM corporates are also less leveraged than their US and European counterparts. At the beginning of the year, US and European investment grade companies had a net leverage of 2.4x and 3.1x respectively, versus 1x for EM corporates.
Fig 2. Net leverage of EM corporates. The measure excludes the real estate sector.
With that, we do not have the presumption to affirm that all Emerging economies will be spared from the slowdown in the global economic growth and the rise in financing costs. This year, an increasing number of countries have come under pressure. Sri Lanka, Kenya and Pakistan are all good examples of how rising oil and agriculture product prices can affect fragile commodity importers. However, there are some other regions in the world that have benefited this year and are going to continue to benefit in the future. Latin America is clearly a winner due to its large commodity production. Brazil, for instance, is not only rich in oil but is also the largest producer of sugar, meat, cellulose, coffee, soybeans and orange juice. Other regions benefiting from high commodity prices are the Middle East and some countries in Africa. Of course, this situation is not only beneficial for countries, but also for corporates. In the first two quarters, we have seen many corporates operating in the commodities sector continued to improve their financial position. One example is Gran Tierra Energy, a Colombian oil producer that cut its leverage by half in the first two quarters of 2022. Going forward, we expect this trend to continue.
Commodity markets – fundamentals remain supportive
Our view on commodities is driven by many years of underinvestment in the oil & gas and metals industries. This, together with the switch from fossil fuels to more environmentally friendly alternatives and the conflict in Ukraine, has created the conditions for high commodity prices in the longer term.
Following the strong economic recovery in 2021, oil inventories are now at historically low levels. The sanctions against Russia contribute to additional shortage to the market. Europe still imports oil from Russia, but as part of its sixth sanctions package the EU said it would halt imports of Russian crude by sea in December and also ban imports of petroleum products from February 2023. Russia supplies 27% of the total oil import to Europe. As Europe moves away from Russian oil, we expect additional tightness in the market, which will lead to higher oil prices. Some could argue that the energy crisis can be solved by drilling more. However, this crisis started before the war in Ukraine and many of the problems are structural. Investors have been (and are still) asking oil companies for more investments in renewables. Because of this, producers like Shell and Exxon are increasing their investments in solar systems and wind turbines, taking away resources for oil and gas exploration. The result has been a decline in investments for new oil production of around 70% since 2014. Even if more is invested now, it will take years to increase production in a sustainable way. In the next few years, we will have to live with a tight supply of oil and gas. This is also because the population of emerging markets (around 7bn today) is set to increase further and demand will remain high. Today an Indian consumes on average 1 barrel of oil per year, an American 18 barrels.
The energy transition will also require a large amount of base metals. Copper, nickel and lithium are just some of the minerals that are needed for green technologies. These base metals are mainly coming from emerging markets. As an example, 40-45% of copper comes from Chile, Peru and Mexico, while 50% of nickel comes from Indonesia and the Philippines. Demand for minerals linked to the green transition are expected to at least double by 2040. Electric vehicles, an important tool to achieve the green energy agenda of governments worldwide, use almost six times more minerals than normal cars. We believe that the mining industry, which like the oil industry has underinvested for years, will struggle to meet this increase in demand. It takes 3-5 years from the discovery of a raw material deposit to the first production. All this can only mean one thing: higher prices.
Author: Andranik Safaryan, Portfolio Manager of the MainFirst Emerging Markets Corporate Bond Fund Balanced & the MainFirst Emerging Markets Credit Opportunities Fund.